

Research Classes

Selank Peptide Research: Tuftsin Analog, GABA and BDNF Studies
Selank peptide research starts with an unusual origin story. Most research peptides begin as fragments of a hormone or growth
Looking for research-grade compounds?
Open any credible research-peptide certificate of analysis and the first thing you’ll see is the HPLC section: a purity number, usually 95% or higher, and a chromatogram full of peaks. For most researchers, that number is the whole story. It shouldn’t be.
Peptide HPLC purity testing is the workhorse analytical method behind nearly every peptide COA in the research market. It separates everything in a vial by chemical behavior and scores how much of it is the target molecule. But the headline percentage is the beginning of the story, not the end: a 99% claim from one lab can mean something very different from 99% from another, and there are real failure modes a clean-looking number hides entirely. This guide explains what the test actually measures, how to read the chromatogram, and exactly what the number can’t tell you.
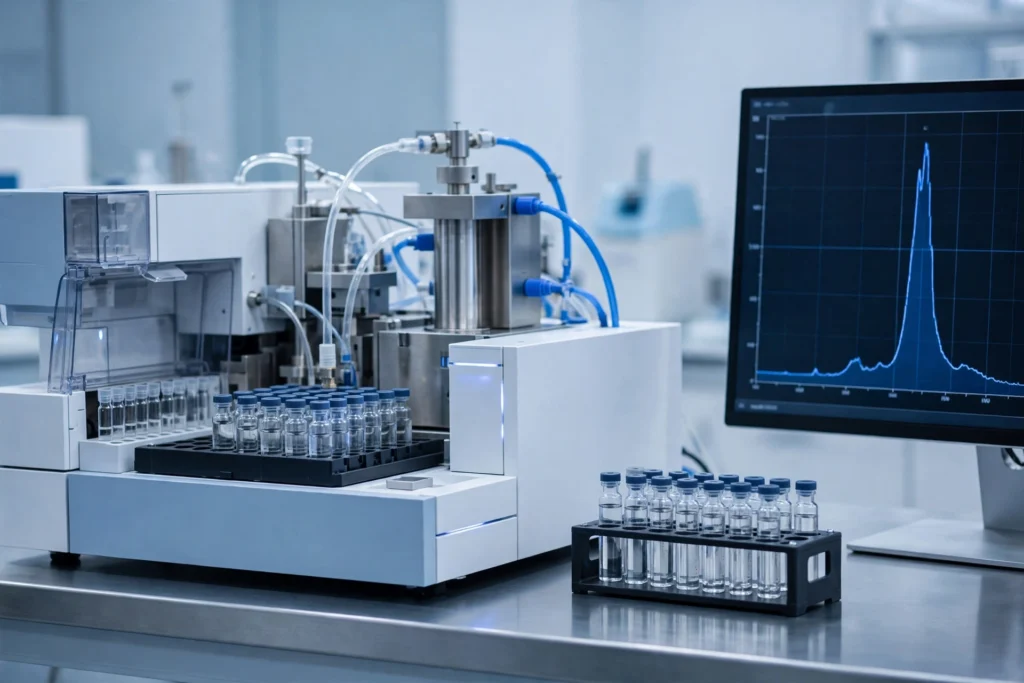
HPLC — high-performance liquid chromatography — is a separation technique. A pump forces a liquid (the mobile phase) through a steel column packed with microscopic particles (the stationary phase) under very high pressure. The sample is injected into that flowing stream, and each component interacts with the packing differently: components that cling to it travel slowly, components that prefer the liquid rush through. Everything mixed together in the vial exits the column at different times, one species after another.
As each component exits, it passes a UV detector set to 214 nm or 220 nm — wavelengths that detect the peptide bond itself. The instrument records the signal over time and produces the chromatogram: a graph of peaks, where each peak represents a different molecular species that was in the sample.
“RP-HPLC” appears on nearly every peptide COA. The stationary phase is hydrophobic — typically silica beads coated with 18-carbon chains (a “C18 column”) — while the mobile phase starts watery and becomes progressively more organic. The run begins with mostly water (plus ~0.1% trifluoroacetic acid, TFA) and ramps up acetonitrile over the course of the run. Peptides stick to the hydrophobic packing at first, then release as solvent strength rises — the more hydrophobic the molecule, the later it elutes.
Each peptide therefore has a characteristic retention time under a given set of conditions, and related impurities elute at slightly different times — which is exactly what makes the separation useful. The TFA acts as an ion-pairing agent, associating with the peptide’s charged groups to sharpen peak shape. That matters: poorly shaped, tailing peaks smear impurities into the main peak and inflate apparent purity.
The chromatogram is the actual evidence; the purity number is just arithmetic done on it.
The horizontal axis is retention time in minutes — how long each component took to travel through the column. The vertical axis is detector response, usually in milliabsorbance units (mAU). Peaks rise from the baseline wherever material is eluting.
The largest peak is the target peptide. In a high-purity sample (above 95%), it should dominate. Check three things:
The small peaks are the impurities, and knowing where they come from is half the value of reading a chromatogram. Solid-phase peptide synthesis builds chains one amino acid at a time, and every coupling step is imperfect. The usual suspects: deletion sequences (chains missing one amino acid, often eluting close to the main peak), truncated sequences (chains that stopped growing early, eluting sooner), oxidized forms (methionine or cysteine residues that picked up oxygen), and diastereomers (a D-amino acid where an L should be — nearly identical to the target and barely separable).
A flat, quiet baseline means clean solvents, a healthy detector, and a well-maintained instrument. A drifting or noisy baseline makes peak integration — the math behind the purity number — less trustworthy.
The software integrates (measures the area under) each peak, then divides the main peak’s area by the total area of all integrated peaks:
Purity (%) = (area of main peak ÷ total area of all peaks) × 100
| Peak | Area % |
|---|---|
| Main peptide peak | 98.6% |
| Impurity 1 (early eluter) | 0.7% |
| Impurity 2 | 0.4% |
| Impurity 3 | 0.3% |
| Reported purity | 98.6% |
What the number does not include matters just as much. Area percent is relative, not absolute: it says nothing about salts (lyophilized peptides typically carry TFA counterions plus residual water, neither absorbing strongly at 214 nm) or about non-peptidic contaminants the detector can’t see at the chosen wavelength. And it’s only as honest as the integration — software settings decide which tiny peaks get counted and which get ignored as noise.
That’s also why net peptide content is a separate measurement. A vial labeled 10 mg containing 99% pure peptide does not necessarily contain 9.9 mg of peptide — the dry powder’s mass includes salts and water. A complete COA reports net content separately.
HPLC is a separation and quantification tool, not an identification tool. Its blind spots are the part most buyers skip.
A 99% pure sample of the wrong molecule reads exactly like a 99% pure sample of the right one. HPLC measures uniformity, not identity. Confirming the molecule requires mass spectrometry, which measures the mass and checks it against the expected sequence. A COA showing HPLC purity without mass spec data is an incomplete document — our guide to reading a full certificate of analysis walks through how the two tests fit together.
During synthesis, an L-amino acid can partially flip into its D mirror image. The resulting impurity has an identical molecular weight — so mass spec can’t see it either — and nearly identical retention time on standard reversed-phase HPLC. A COA can read 98–99% while a meaningful fraction of the material is stereochemically wrong, which can dramatically alter behavior in receptor-binding assays. Catching it requires chiral HPLC or MS/MS after enzymatic digestion — beyond a routine COA.
Closely related impurities can co-elute with the target, merging into one apparently clean peak. A shallow gradient separates similar species better than a steep one, so a chromatogram run on an aggressive fast method can look cleaner than the sample deserves. A single sharp peak is reassuring, not proof.
HPLC with UV detection sees peptide bonds — not bacteria or bacterial byproducts. Sterility and endotoxin (LAL) testing are separate assays that belong on a complete COA for any material contacting cell cultures.
So much of the number depends on method choices that comparing purity claims across suppliers means comparing methods, not just percentages. Different gradients, column age and chemistry, detection wavelengths, sample prep, and integration thresholds can all move the reported number for the same vial. None of that makes the test unreliable — it makes the number meaningless without context.
The method details should be printed on the COA: column type and dimensions, mobile phase composition, gradient profile, flow rate, detection wavelength. A COA that gives a number but no method is asking you to trust a score without seeing the test — and when the only testing is in-house, with no independent third-party verification, that trust is doing a lot of heavy lifting.
Most research suppliers target 95% or higher, with 98–99%+ considered high grade. For quantitative work — where concentration accuracy affects results — the higher end matters, backed by a chromatogram and mass spec rather than a typed number.
HPLC purity is the percentage of peptide-related material that is the target molecule. Net peptide content is the actual mass of peptide in the vial, excluding TFA counterions and water. A 10 mg vial of 99% pure peptide may contain meaningfully less than 9.9 mg of actual peptide.
Sometimes cost-cutting, sometimes a genuine misunderstanding that purity equals identity. Either way, treat it as incomplete — the two tests answer complementary questions, and reputable third-party labs run both as standard.
No. UV detection at peptide wavelengths sees peptide bonds, not bacteria or endotoxins. Sterility and LAL endotoxin testing are separate assays.
Peptides degrade — deamidation, oxidation, and aggregation progress even under good storage. A COA generated at manufacture doesn’t describe the material two years later. For older stock, a fresh HPLC run is the honest way to confirm the material still matches its label.
HPLC is the single most informative routine assay in the research-peptide world — and the single most misunderstood. The chromatogram tells you how clean the separation was, how honest the integration looks, and whether the impurity profile matches real synthesis chemistry. The number alone tells you almost none of that. Learn to read the peaks, demand the mass spec, check the method, and never let a percentage do your thinking for you. Browse the research peptide catalog with that lens, and every COA you ever open will read differently.
All Apex Bio Industries compounds are supplied strictly for laboratory research use only. This article is educational content about analytical chemistry methods and does not constitute medical, safety, or usage advice. Research peptides are not for human or veterinary use, and nothing on this site should be interpreted as instructions for administration, dosing, or personal use.
Related in the Apex shop: COA & third-party testing at Apex Bio · research peptides at Apex Bio — supplied strictly for laboratory research use.
Selank peptide research starts with an unusual origin story. Most research peptides begin as fragments of a hormone or growth

Retatrutide Peptide Research: The Triple Agonist, TRIUMPH Trials and FDA Status Retatrutide peptide research is where incretin science stopped adding

Sermorelin Peptide Research: GHRH(1-29), GH Pulses and FDA History Sermorelin peptide research occupies an unusual place in the peptide literature:
Join the Apex list for research articles, compound guides, and subscriber-only offers. Enter your email and your 10% code appears instantly.
Use code Apex10
at checkout for 10% off.

Age Requirement
You must be 21 years or older to enter this website.
Apex Bio Industries is intended only for adults aged 21 and older. Individuals under the age of 21 are not permitted to access, purchase, or interact with products or content available through this website.
Research Use Only
All products offered by Apex Bio Industries are intended strictly for Research Use Only (RUO) purposes. These products are provided exclusively for laboratory research, scientific investigation, and educational purposes by qualified researchers and institutions. Products are not intended for human consumption, clinical use, medical treatment, diagnosis, prevention, or cure of any disease or condition. Apex Bio Industries does not provide medical advice, treatment recommendations, or instructions for personal use. Customers are responsible for ensuring that their purchase, handling, storage, and use of products comply with applicable laws, regulations, and institutional guidelines.
Please check the box above to confirm you are 21 years or older.