

Research Classes

Selank Peptide Research: Tuftsin Analog, GABA and BDNF Studies
Selank peptide research starts with an unusual origin story. Most research peptides begin as fragments of a hormone or growth
Looking for research-grade compounds?
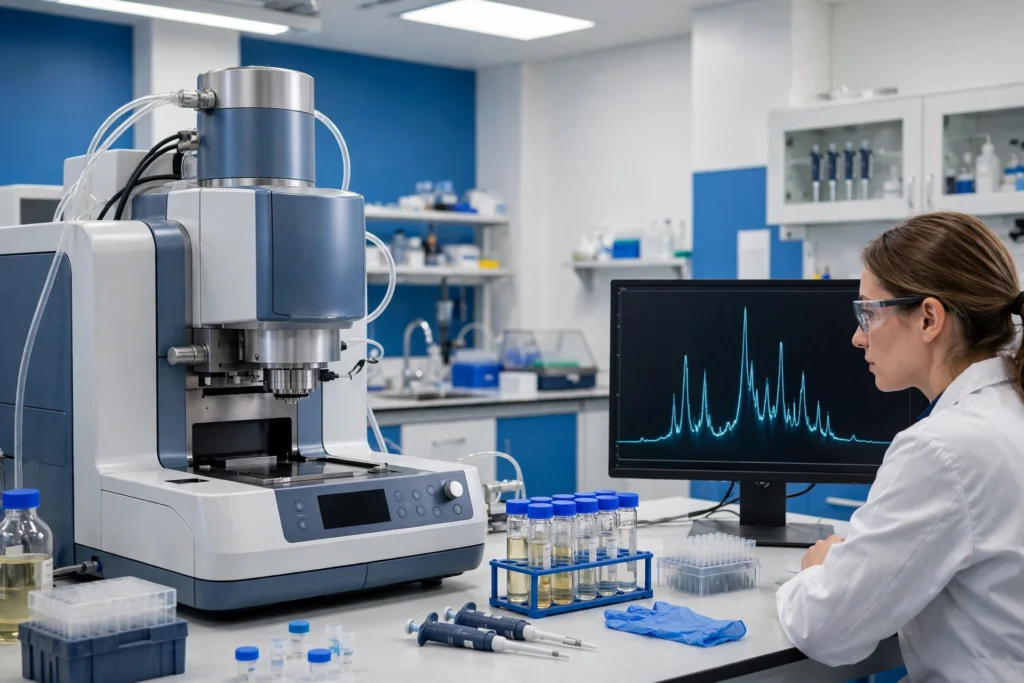
Peptide mass spectrometry weighs individual molecules with extraordinary precision and compares the result against the mass predicted from the amino acid sequence. A peptide can pass an HPLC purity test at 99% and still be the wrong compound entirely, because chromatography measures uniformity, not identity. This guide explains how peptide mass spectrometry works, how to read the spectrum on a certificate of analysis, what the extra peaks usually mean, and what even a perfect mass match cannot prove.
A mass spectrometer does not weigh neutral molecules sitting in a vial. It measures the mass-to-charge ratio (m/z) of ions — molecules that have been given an electrical charge and launched into the gas phase. The instrument sorts those ions by m/z, counts them, and records the result as a spectrum: peaks along an m/z axis, with peak height showing relative abundance.
Every instrument, from a benchtop single-quadrupole to a research-grade Orbitrap, has the same three fundamental parts, a structure described in standard references such as Sinha and Mann’s beginner’s guide to mass spectrometry–based proteomics in The Biochemist (Portland Press, 2020):
The mass analyzer defines resolution and accuracy. A low-resolution instrument reports masses to roughly a tenth of a dalton; a high-resolution TOF or Orbitrap can measure within a few parts per million — precise enough to distinguish peptides differing by a fraction of a neutron’s mass. That precision matters when you judge how tight a COA’s identity claim really is.
Two ionization techniques account for nearly every peptide mass spectrum on a commercial COA. They produce recognizably different spectra, and knowing which one generated your document explains its shape.
| Feature | ESI (electrospray) | MALDI |
|---|---|---|
| How it works | Solution sprayed through a high-voltage needle (2–4 kV); evaporating droplets release gas-phase ions | Peptide co-crystallized with a matrix on a plate; a laser pulse desorbs and ionizes it |
| Typical charge states | Multiply charged: [M+2H]²⁺, [M+3H]³⁺ are common | Mostly singly charged: [M+H]⁺ dominates |
| Pairs naturally with | LC-MS — the HPLC effluent feeds straight into the source | TOF analyzers (MALDI-TOF), often as a fast stand-alone check |
| Spectrum appearance | A family of peaks, one per charge state | Usually one main peak near the full molecular mass |
Neither is “better” for a basic identity check. What matters is that the COA names the method, because the expected peak pattern — and the honest tolerance for the result — depends on it.
Peptides are built from carbon, hydrogen, nitrogen, oxygen, and sometimes sulfur — and carbon exists as isotopes. Most carbon atoms are ¹²C, but roughly 1.1% are the heavier ¹³C. That produces two legitimate ways to state a peptide’s mass:
For a small peptide the two values sit within a fraction of a dalton. For a 4–5 kDa peptide, they can differ by 2–3 Da. A COA that compares a measured monoisotopic mass against a listed average mass can look “off” by several daltons while being perfectly correct — and the reverse comparison can hide a real error. Confirm the observed and theoretical values are the same kind of mass; if the document does not say which it reports, ask the supplier.
Because ESI adds multiple protons, an ESI spectrum shows m/z values per charge state, not the mass directly. Converting back is simple arithmetic. For a doubly charged ion:
m/z = (M + 2 × 1.0073) ÷ 2
Worked example: a peptide with a neutral mass of 1,200.60 Da appears at m/z 601.31 as [M+2H]²⁺ and at m/z 401.21 as [M+3H]³⁺. Software performs this conversion across the whole charge-state family — called deconvolution — and reports the reconstructed neutral mass that the COA compares against theory.
You can also read charge off the isotope cluster. Isotope peaks are separated by about 1 Da of mass, so on the m/z axis they appear spaced by 1 ÷ z: roughly 1.0 apart for 1+, 0.5 for 2+, 0.33 for 3+. Peaks half a unit apart are the visual signature of a doubly charged peptide — a quick sanity check on any printed spectrum.
“Observed mass matches theoretical mass” is not a yes-or-no statement; it is a measurement with an error, and good COAs report it. On high-resolution instruments the error is expressed in parts per million:
Mass error (ppm) = ((observed − theoretical) ÷ theoretical) × 1,000,000
Example: a theoretical mass of 1,200.6000 Da measured at 1,200.6060 Da is an error of about 5 ppm — excellent, and tight enough to rule out almost any single-amino-acid substitution. On a lower-resolution instrument, tolerances are honestly wider — a few tenths of a dalton is normal for a unit-resolution quadrupole — and a COA should be judged against its own instrument class. What should concern you is not a modest stated error; it is a COA that reports no error at all, or quotes high-resolution precision from an instrument that cannot deliver it.
Real spectra contain more than the main peak. Most extra peaks have mundane explanations, and naming them beats lumping them together as “impurities.” Mass shifts below are relative to the unmodified protonated peptide, following standard proteomics mass-difference tables:
| Observation | Mass shift | What it usually means |
|---|---|---|
| Sodium adduct [M+Na]⁺ | +21.98 Da vs. [M+H]⁺ | Sodium replaced a proton — a measurement artifact, not a different molecule |
| Potassium adduct [M+K]⁺ | +37.96 Da vs. [M+H]⁺ | Same story with potassium; common in MALDI spectra |
| Oxidation | +15.99 Da | An added oxygen, typically on methionine or tryptophan; a real modification that grows with age and air exposure |
| Deamidation | +0.98 Da | Asparagine or glutamine converted to the acid; slow degradation — only high-resolution instruments resolve this shift cleanly |
| Disulfide bond formation | −2.02 Da | Two cysteines oxidized into a bridge; expected for many sequences, an error if the sequence should be reduced |
| Water loss | −18.01 Da | Often an in-source fragment rather than a property of the bulk material |
| Deletion sequence | −(mass of one residue) | A chain missing an amino acid — a genuine impurity from solid-phase synthesis |
The practical lesson: adducts describe the measurement, modifications describe the molecule, and deletions describe the synthesis.
Intact mass confirms the total. Tandem mass spectrometry (MS/MS) goes further: the instrument isolates one ion, fragments it by collision with an inert gas such as nitrogen or argon, and measures the pieces. Peptides break preferentially at their backbone amide bonds, producing two families of fragments — b-ions, which keep the N-terminus, and y-ions, which keep the C-terminus.
Consecutive b- or y-ions differ by exactly the mass of one amino acid residue, so the peak ladder reads like a staircase: each step names the next residue. Even a short readable stretch — a sequence tag — is far stronger identity evidence than total mass alone. MS/MS rarely appears on routine commercial COAs, but it is the technique behind serious identity disputes and any claim that a spectrum “confirms the sequence” rather than merely the mass.
MS is powerful, which makes its blind spots more dangerous — they are easy to forget. Four limits belong in every researcher’s mental model:
Leucine and isoleucine have identical mass. A peptide built with one where the sequence calls for the other returns a perfect mass match. Standard MS/MS cannot separate them either; distinguishing them takes specialized fragmentation or chromatographic comparison against a reference standard.
Structural isomers — a scrambled sequence with the same composition, or a disulfide bridge paired between the wrong cysteines — weigh exactly the same as the correct molecule. Mass confirms composition, not connectivity — one reason MS complements rather than replaces the retention-time evidence in an HPLC purity analysis.
Ionization efficiency varies enormously between compounds, so spectrum peak heights do not translate into percentages of material, and MS says nothing about net peptide content, water, or counterions. Purity belongs to HPLC; quantity belongs to dedicated content assays. Our complete guide to reading a peptide COA shows how the tests divide the work.
A flawless identity result can accompany material that was never tested for bacterial contamination. Sterility and LAL endotoxin results are separate line items; their absence means untested, not passed.
Identity confirmation. It verifies that the dominant molecule in the vial has the mass predicted by the labeled amino acid sequence — the check that catches wrong-compound, deletion, and major modification failures that an HPLC purity percentage cannot.
It depends on the instrument. High-resolution LC-MS should agree within roughly 5–10 ppm; lower-resolution instruments honestly report a few tenths of a dalton. Judge the number against the named method, and distrust any COA stating no tolerance at all.
No. An exact match rules out most synthesis failures, but leucine/isoleucine swaps, sequence isomers, and wrong disulfide pairing all share the target mass. Combined with HPLC retention behavior and, where it matters, MS/MS sequencing, mass becomes strong evidence — alone, it is only necessary evidence.
HPLC tells you how clean a vial is; peptide mass spectrometry tells you what is actually in it. Once you know the grammar — both masses printed, same kind of mass, error that fits the instrument, extra peaks you can name — the mass spectrum stops being decoration and becomes the identity evidence behind every other claim on the page. Browse the research peptide catalog and apply the same checklist to any COA, from any supplier, including ours.
Related in the Apex shop: COA & third-party testing at Apex Bio · research peptides at Apex Bio — supplied strictly for laboratory research use.
All Apex Bio Industries compounds are supplied strictly for laboratory research use only. This article is educational content about analytical chemistry methods and does not constitute medical, safety, or usage advice. Research peptides are not for human or veterinary use, and nothing on this site should be interpreted as instructions for administration, dosing, or personal use.
Selank peptide research starts with an unusual origin story. Most research peptides begin as fragments of a hormone or growth

Retatrutide Peptide Research: The Triple Agonist, TRIUMPH Trials and FDA Status Retatrutide peptide research is where incretin science stopped adding

Sermorelin Peptide Research: GHRH(1-29), GH Pulses and FDA History Sermorelin peptide research occupies an unusual place in the peptide literature:
Join the Apex list for research articles, compound guides, and subscriber-only offers. Enter your email and your 10% code appears instantly.
Use code Apex10
at checkout for 10% off.

Age Requirement
You must be 21 years or older to enter this website.
Apex Bio Industries is intended only for adults aged 21 and older. Individuals under the age of 21 are not permitted to access, purchase, or interact with products or content available through this website.
Research Use Only
All products offered by Apex Bio Industries are intended strictly for Research Use Only (RUO) purposes. These products are provided exclusively for laboratory research, scientific investigation, and educational purposes by qualified researchers and institutions. Products are not intended for human consumption, clinical use, medical treatment, diagnosis, prevention, or cure of any disease or condition. Apex Bio Industries does not provide medical advice, treatment recommendations, or instructions for personal use. Customers are responsible for ensuring that their purchase, handling, storage, and use of products comply with applicable laws, regulations, and institutional guidelines.
Please check the box above to confirm you are 21 years or older.